

Why exchange flows matter more than ever
When traders talk about “volatility coming,” they usually stare at charts, not at wallets. But if you look at crypto exchange inflow outflow analysis for BTC and ETH, you often see the move *before* the price candle hits. Large bitcoin and ethereum on chain data for trading shows that spikes of coins moving onto CEXs usually precede sell pressure, while big outflows to cold storage or DeFi hint at accumulation. In a market where narratives change weekly, exchange flows are one of the few signals tied directly to trader behavior and liquidity.
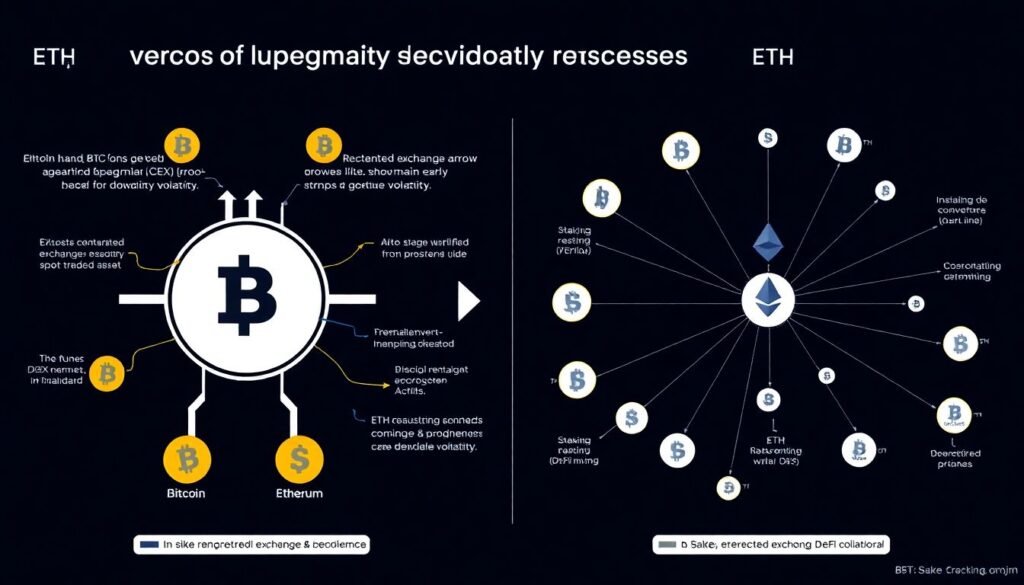
CEX vs DEX: different flows, different intentions
Centralized exchanges (CEX) and decentralized exchanges (DEX) tell different stories. When whales send BTC or ETH to Binance or Coinbase, that’s usually preparation for active trading or liquidation. When those same coins move off CEX into self‑custody or DeFi pools, it often signals long‑term conviction. On DEXs, flows are more about yield and leverage: adding liquidity, entering perp positions, or looping collateral. Watching how much supply migrates from CEX to DEX helps estimate where future volatility will be concentrated: spot dumps on CEX, or leveraged blow‑ups on-chain.
Key stats traders should keep an eye on
You don’t need a quant desk to track useful metrics. For BTC and ETH, on-chain dashboards regularly highlight: net exchange position change, stablecoin inflows to trading venues, DEX volume share versus CEX, and funding rates. Historically, sharp daily net inflows of BTC to major CEXs have lined up with local tops, while sustained multi‑week outflows often marked early bull phases. When paired with order‑book depth, these numbers become some of the best crypto volatility indicators for btc eth, revealing whether a move can snowball or will quickly fade.
How to use exchange flows for crypto trading signals
Think of flows as context, not a standalone “buy/sell” button. Here’s a simple way how to use exchange flows for crypto trading signals without overcomplicating things:
– Big BTC/ETH inflow to CEX + euphoric funding = trim exposure or tighten stops
– Consistent outflows + depressed funding + low DEX liquidations = start scaling into spot
– Rising DEX volumes + stablecoin inflows = prep for larger intraday swings
Used like this, flows don’t predict exact tops or bottoms, but they filter out low‑probability trades and late entries.
Expert takes: what on-chain pros actually watch
Analysts from major on chain analytics platform for btc eth traders often repeat the same point: don’t obsess over single spikes. They recommend focusing on *trends* in 7–30 day moving averages. A one‑day 20k BTC inflow means little if the prior month saw record outflows. Seasoned desks also cross‑check flows with macro data and derivatives: if equities are risk‑off, BTC inflows are more likely to turn into real selling, not just internal reshuffling. The pro mindset is simple: flows are a puzzle piece, and you always need the whole picture.
Economic angles: liquidity, risk appetite and macro

Exchange inflows/outflows are basically a barometer of risk appetite. When macro conditions tighten—higher real rates, stronger dollar—more coins drift back onto CEX as traders seek liquidity. That raises the odds of sharp downside moves. In risk‑on phases, ETH flowing into DeFi to farm yields or secure staking rewards signals that holders prefer return over safety. BTC moving into long‑term addresses shows reduced free float, magnifying the price effect of new demand. So flows don’t just mirror market mood; they quietly shape it by altering available supply.
Forecasts: what flows hint about BTC and ETH volatility
Looking ahead, the growth of DEXs and L2s likely makes flow patterns more segmented. For BTC, CEX inflows should remain the main early warning sign of downside volatility, as it’s still predominantly a spot‑traded asset. For ETH, the mix of staking, restaking and DeFi collateral means DEX and protocol‑level flows may gain predictive power. Many analysts expect regimes where volatility clusters: calm periods with steady outflows followed by short, violent bursts when coins rush back to venues. Tracking where liquidity sits will be crucial in navigating those cycles.
Practical checklist for everyday traders
You don’t have to watch every dashboard, but a small routine helps. Before big moves or news events, traders can quickly review:
– Net BTC/ETH CEX inflow over the last 24–72 hours
– Change in DEX share of total trading volume
– Stablecoin inflows to major exchanges and on‑chain lending markets
Combined with simple price structure and funding rates, this gives a grounded read on whether a breakout has “fuel” or is running on fumes.
Impact on the wider crypto industry
As more participants rely on bitcoin ethereum on chain data for trading decisions, projects are adapting. Liquidity providers adjust inventory based on flow trends; market makers design algorithms that fade panic inflows or step back when outflows drain order books. Regulators also watch these patterns to spot stress in real time, especially around large CEXs. The narrative “code is law” now coexists with “data is edge”: whoever best interprets the constant stream of CEX and DEX flows gains a structural advantage in an increasingly competitive market.