

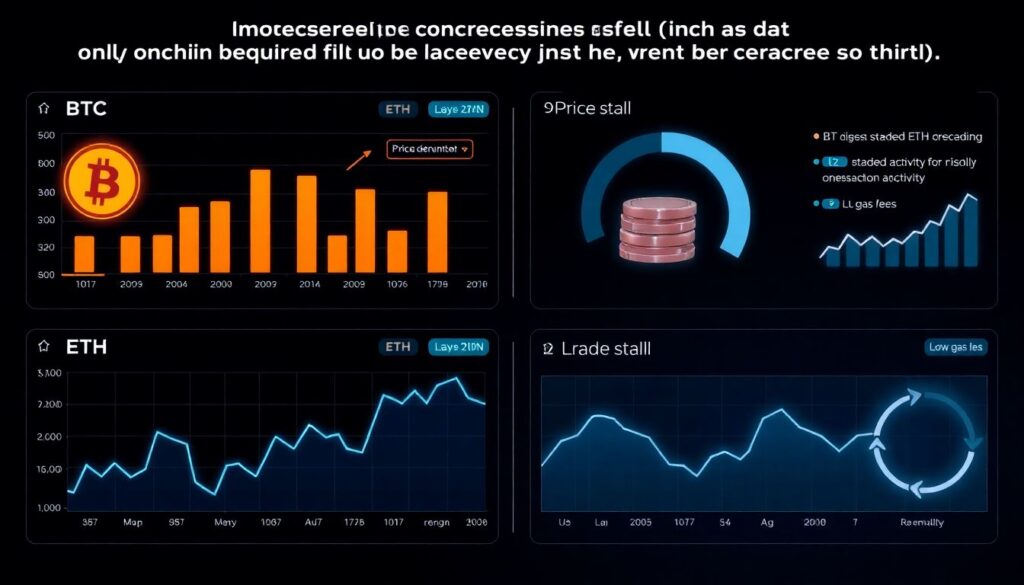
Why On-Chain KPIs Matter More Than Ever in 2025
In 2025, markets move at a speed where classic TA lines and lagging indicators feel like dial‑up internet. For BTC and ETH, the real edge now sits right in the raw blockchain data: who’s buying, who’s selling, how long they’ve been holding, и whether liquidity is drying up or flooding in. On‑chain metrics turn that chaotic flow of transactions into readable signals. Instead of guessing sentiment from Twitter threads, you can see it directly in wallets and mempools. The good news: you don’t need to be a protocol engineer to use it; modern tools hide the complexity behind clean charts and alerts.
Core Idea: What On-Chain KPIs Actually Show You
On-chain KPIs are quantifiable signals derived from the blockchain itself: transfers, balances, age of coins, realized prices. For bitcoin and ethereum these metrics act like an X‑ray for network health and capital flows. While news and narratives explain “why” the market might move, on‑chain tells you “how” it is already moving under the surface. Long‑term holders adding to positions, exchanges being drained, smart money rotating from BTC to ETH — all of this appears first in data, then in price. Treat these KPIs as an evidence‑based layer that either confirms or challenges your trading thesis.
Trend 2025: From Static Charts to Streaming Dashboards
The big shift by 2025 is real‑time streaming. Instead of refreshing slow websites, traders now expect a real time bitcoin ethereum on chain data dashboard that updates block by block. This matters because in volatile windows — ETF news, protocol upgrades, macro shocks — hours or even minutes of delay can turn a winning idea into a chase. Modern platforms aggregate mempool activity, exchange flows and DeFi positions into live panels, so you can react while the move is forming, not after the candle closes. In practice, your on‑chain screen becomes as important as your order book screen.
Key KPI Group #1: Liquidity and Exchange Flows
Exchange Net Flows: Are Coins Moving to or from Custody?
The first thing to watch is where BTC and ETH physically sit. When large volumes move from cold wallets to centralized exchanges, that usually signals potential sell pressure. When coins leave exchanges en masse, it often points to accumulation. In 2025, the better on chain analytics platform for btc and eth lets you slice this by type of exchange (spot vs derivatives), region and even by “sticky” long‑term holders versus active traders. Your job: track direction, size and persistence of these flows instead of obsessing over every single transaction.
Practical uses:
– Spot big inflow spikes after price rallies – a sign holders may be ready to take profit.
– Monitor sustained outflows during consolidations – potential quiet accumulation.
– Compare BTC and ETH flows to see where risk appetite is shifting first.
Stablecoin and Tokenized Fiat Flows
For ethereum especially, stablecoins act as dry powder. Rising stablecoin balances on exchanges can precede big moves, because sidelined capital is ready to deploy. Falling balances may indicate that liquidity is already “all‑in.” Combined BTC and ETH analysis benefits from watching how USDT, USDC and tokenized dollars move across chains and venues. In 2025 we also see more treasury‑grade stablecoin flows; these larger, slower wallets can hint at institutional positioning well before public filings or press releases appear.
Key KPI Group #2: Holder Behavior and Market Structure
Long-Term vs Short-Term Holder Supply
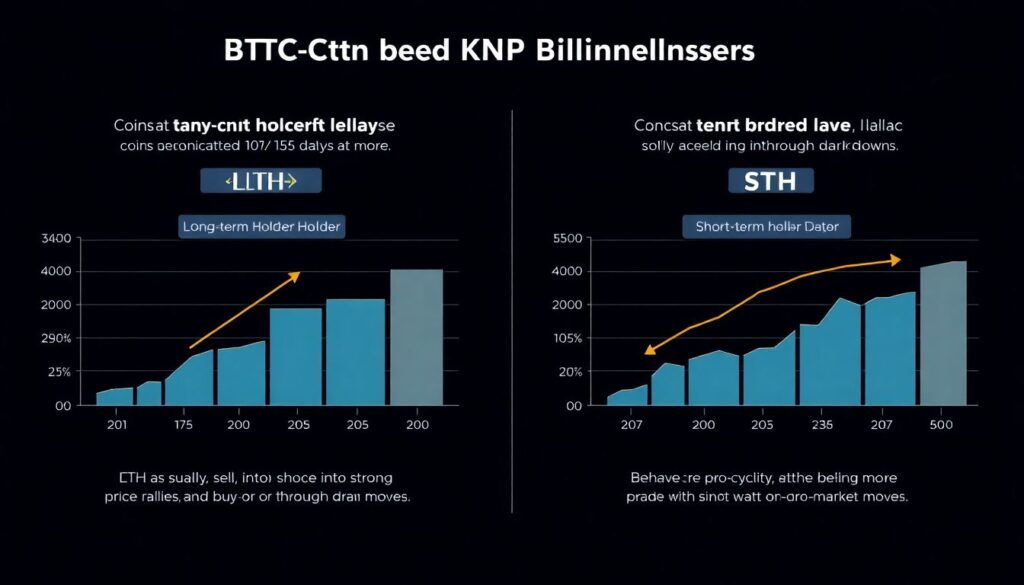
One of the most powerful BTC ETH on chain KPI analytics for investors is holder segmentation by coin age. Long‑term holders (LTH) — coins untouched for, say, 155 days or more — tend to sell into strong rallies and buy or sit through drawdowns. Short‑term holders (STH) behave much more pro‑cyclically. Watching how much supply each group controls gives you a structural picture: if LTH supply is high and rising while price drifts sideways, the market is often building a strong base. Conversely, if LTH supply drops sharply during euphoric price spikes, you’re likely in a distribution phase.
Realized Cap and Realized Price Bands
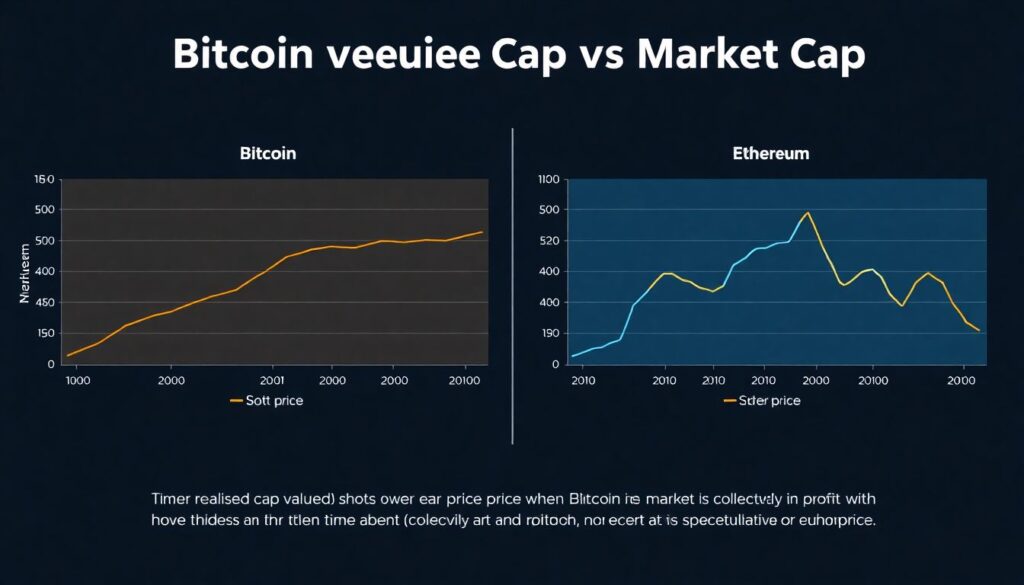
Realized cap values each coin at the price when it last moved, not the current market price. For bitcoin and ethereum this smooths out noise and shows the average “entry price” of the network. When spot price trades far above realized price, the market is collectively in profit — fertile ground for profit‑taking and sharp corrections. In 2025, many tools visualize realized price bands for different cohorts (1–3 months, 6–12 months, 3–5 years). Watching where these bands sit relative to spot gives concrete zones of support and resistance grounded in actual cost basis, not arbitrary lines.
Key KPI Group #3: Profit, Loss and Sentiment in the Ledger
SOPR and Realized Profit/Loss
Spent Output Profit Ratio (SOPR) measures whether coins being spent are, on average, in profit or loss. Sustained periods where most coins are sold in profit usually mark bull phases; repeated selling at a loss shows capitulation and exhaustion. In 2025, instead of reading SOPR in isolation, it’s more effective to overlay it with price and volume and to split it by size: retail‑sized UTXOs vs whale‑sized movements. When whales sell heavily in profit while retail keeps buying, you know who is providing liquidity to whom.
Practical reads:
– Rising price + rising profit‑taking, but low volume: often still early bull.
– Rising price + massive profit‑taking + surge in new addresses: late cycle risk.
– Falling price + heavy realized losses that start to shrink: potential bottoming.
Unrealized Profit/Loss and “Pain Thresholds”
Unrealized profit/loss tracks how “comfortable” the average holder is. In BTC and ETH cycles, price peaks often align with extreme unrealized profit — everyone feels brilliant and few want to sell “too early.” Lows coincide with widespread unrealized loss and apathy. By 2025, many dashboards present this as a sentiment gauge layered on macro and funding data. The trick is not to trade every wiggle; instead, use extremes to frame risk: when unrealized profit is sky‑high, tighten stops and shorten horizons; when unrealized loss dominates, start planning gradual accumulation rather than panic exits.
Key KPI Group #4: Network Usage and Economic Activity
Active Addresses, Transactions and Fees
Raw activity metrics are simple but still informative when combined intelligently. Growing active addresses, rising transaction counts and healthy fee markets suggest that both BTC and ETH are being used beyond speculation. In 2025, L2s complicate the picture: a lot of economic activity migrates off the base layer. So rather than just counting L1 transactions, look at:
– Total value settled across L1 + major L2s.
– Share of fees paid by DeFi, NFTs, gaming and bridges.
– Correlation between user growth and price trends.
If fees spike while price is flat, it can mean congestion driven by real demand or just memecoin noise; use token type and contract interaction data to distinguish the two.
ETH-Specific: Staking and Restaking Dynamics
Ethereum’s shift to PoS and the 2024–2025 restaking boom made staking KPIs central. Total ETH staked, average validator profitability and concentration across major liquid staking providers now directly influence liquidity and sell pressure. More ETH locked long‑term reduces circulating supply but can increase systemic risk if too concentrated. Watch:
– Growth of liquid staking tokens vs native staking.
– Restaking yields relative to base yields.
– Large unstaking events following regulatory or client‑level news.
These metrics help you judge whether ETH’s yield narrative is attracting sustainable capital or just levering up risk.
Trend 2025: APIs, Automation and Trade Integration
Manually checking charts once a day is no longer enough for serious participants. Most advanced traders now plug a crypto on chain data api for bitcoin and ethereum directly into their execution stack. This enables:
– Alerts when whale wallets move to exchanges.
– Automatic position‑sizing changes based on liquidity or volatility regimes.
– Strategy filters that only trigger entries when both TA and on‑chain agree.
Platforms compete to be the best on chain metrics tool for crypto trading by offering lower latency, better wallet tagging and cleaner historical data. Your advantage comes from choosing a stack you actually understand and can maintain, not from stacking dozens of indicators you never really interpret.
How to Read BTC vs ETH On-Chain in Parallel
BTC and ETH share some KPIs but respond to them differently. For bitcoin, narratives center on digital gold, ETFs, sovereign reserves and long‑term store of value. Exchange flows, LTH supply and macro sensitivity dominate. For ethereum in 2025, the story is more about blockspace demand, L2 adoption, staking yields and DeFi health. When you compare them side by side, look for divergences:
– BTC net inflows while ETH sees outflows from exchanges: rotation toward “safety.”
– ETH gas usage rising while BTC volume stagnates: risk capital shifting to DeFi.
– Strong BTC ETF inflows but weak on‑chain activity: institution‑driven, not retail‑driven rally.
Used this way, a unified on chain analytics platform for btc and eth becomes less about pretty charts and more about mapping capital rotation across the two main “layers” of the crypto market.
Building a Practical On-Chain Workflow in 2025
Step 1: Pick One Primary Dashboard, Not Ten
Instead of collecting accounts on every site, choose a core real time bitcoin ethereum on chain data dashboard that you’ll actually open daily. Criteria:
– Clear segmentation of holder cohorts and exchange flows.
– Low data lag and transparent methodology.
– Good alerting system (email, Telegram, webhooks).
Start with a lean watchlist: BTC and ETH exchange net flows, LTH/STH supply, realized price and one or two network activity metrics. Add complexity only when you can explain, in plain language, what each metric means and how it would change your decisions.
Step 2: Define “If X, Then Y” Rules
On‑chain data only becomes useful when tied to concrete actions. For example:
– “If BTC sees three consecutive days of large exchange inflows while price stalls, I reduce leverage or trim.”
– “If ETH staked supply grows but L2 activity falls and gas stays cheap, I avoid over‑allocating to ETH beta plays.”
– “If both BTC and ETH show rising LTH supply and shrinking exchange balances during a macro scare, I scale into spot positions slowly.”
Write these rules down. Treat them as hypotheses you can refine, not immutable laws.
Step 3: Integrate with Your Trading Style
Day traders will lean more on intraday flows and funding; swing traders care about multi‑week trends in holder composition and realized profits; long‑term allocators focus on structural indicators like LTH supply, staking dynamics and macro liquidity. The same BTC ETH on chain KPI analytics for investors will mean different things depending on timeframe. The mistake many make in 2025 is copying settings from someone else’s script without aligning them to their own horizon and risk tolerance.
Common Pitfalls When Using On-Chain Metrics
Several traps show up again and again:
– Treating every spike as a signal. One‑off whale transfers can be internal reshuffling.
– Ignoring context. Exchange inflows mean very different things during panic vs euphoria.
– Data overfitting. Building strategies that look perfect on the last two years of data but collapse in new regimes.
– Confusing correlation with causation. An indicator “working” a few times isn’t proof of deep structural law.
To avoid these, combine on‑chain with macro, derivatives data and basic price structure. Use on‑chain more as a risk map than a magic entry button.
What’s Next: On-Chain Intelligence Beyond 2025
Looking ahead, the frontier isn’t just more metrics, but better interpretation. We’re already seeing platforms layering machine learning on top of a crypto on chain data api for bitcoin and ethereum to classify wallets, detect regime shifts and predict liquidity crunches before they hit order books. Privacy tech and rollups will obscure some data, but new heuristics and L2 analytics will fill that gap. For you as an investor or trader, the winning move is not chasing every shiny new indicator, but building a small, coherent set of KPIs that you understand deeply and revisiting them consistently. On‑chain won’t replace judgment — it will simply make your judgment harder to fool.