
Bitcoin Active Addresses Sink To 2020 Levels After $83,000 Breakdown: What Comes Next For BTC?
The past week has been brutal for Bitcoin bulls. The benchmark cryptocurrency has shed more than 12% in value, sliding from a failed attempt to hold above $83,000 down toward its next key support area around $77,000. Beneath the price action, however, something arguably more worrying is unfolding: on‑chain activity is collapsing to levels not seen since the depths of 2020.
A new analysis from on‑chain market analyst CryptoOnchain, published on CryptoQuant’s QuickTake, argues that Bitcoin’s current structure leaves “very little chance” of a robust recovery in the near term. Instead, the data points to a market that has been pushed higher without sufficient organic engagement from real network users — a setup that can make downside moves sharper and bounces more fragile.
Network Activity Falls To April 2020 Levels
The core of the analyst’s argument centers on the Bitcoin Active Addresses metric. This measure tracks the number of unique wallet addresses that have sent or received BTC over a given period — in this case, over the last seven days. It is one of the simplest yet most revealing ways to gauge how many distinct participants are actually using the network.
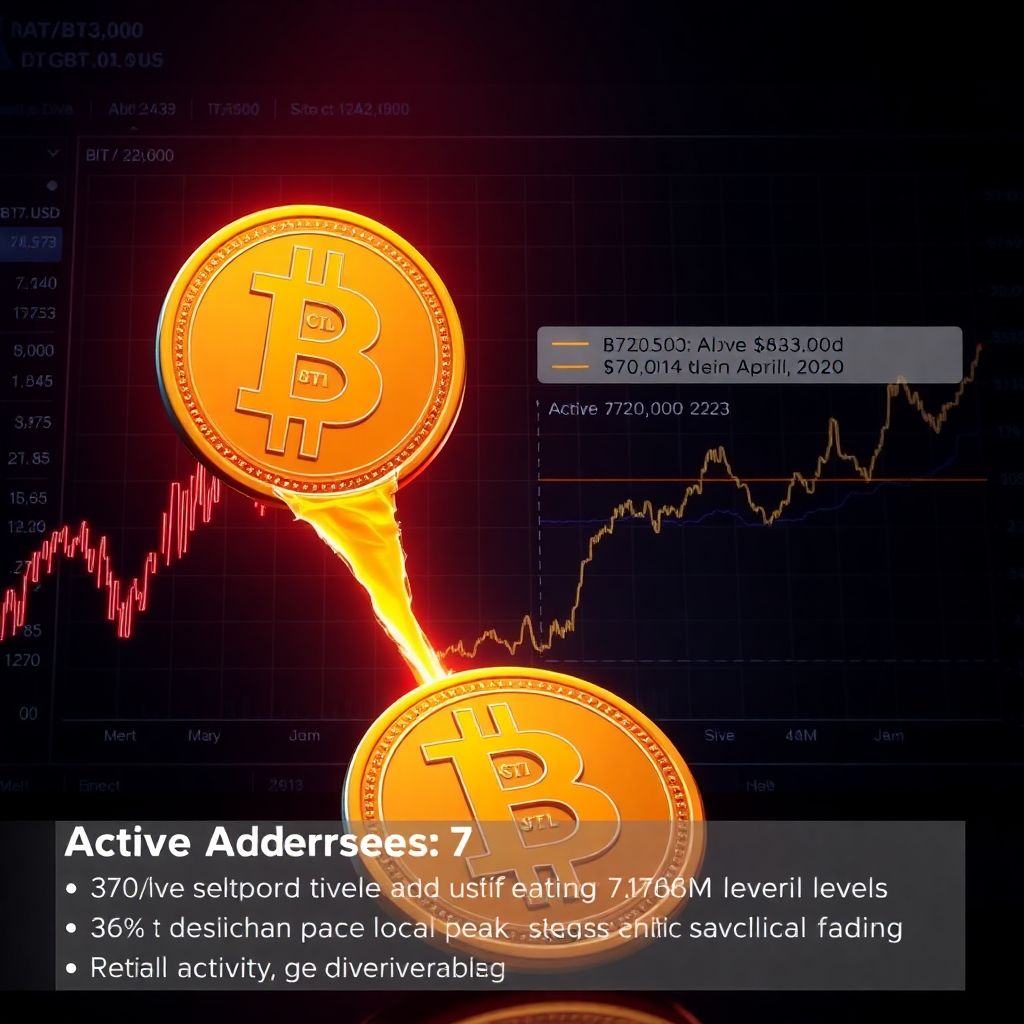
According to CryptoOnchain, the seven‑day active address count recently dropped to around 720,000. That figure is significant because it matches levels last observed in April 2020, when Bitcoin was still recovering from the pandemic‑era crash and trading at far lower prices than today.
For comparison, in November 2024, during a period of heightened enthusiasm and strong bullish momentum, the number of active addresses reached about 1.126 million. The fall from that local peak to today’s reading represents a contraction of roughly 36% in on‑chain participation. In other words, more than a third of the “visible” network activity has dried up in just a few months.
A Growing Gap Between Price And Network Usage
What troubles analysts most is not just the raw drop in active addresses, but the widening disconnect between Bitcoin’s price and its underlying network activity. In April 2020, both metrics were low: prices were depressed and user participation was subdued. Now, Bitcoin is still trading at prices dramatically higher than in 2020, yet its level of network utilization has reverted back to that earlier baseline.
CryptoOnchain identifies this as a structural divergence. Historically, powerful and sustainable bull markets in Bitcoin have tended to coincide with increased transaction activity, new wallets interacting on‑chain, and generally rising user engagement. When price climbs while network usage lags or even falls, it can indicate that speculative flows, derivatives trading, or a narrow group of large holders are dominating the market rather than a broad base of active users.
This mismatch — high price, low activity — suggests that Bitcoin’s latest rise lacked the kind of robust, organic demand that typically provides strong support during corrections. When such demand is absent, sell‑offs can accelerate because there are fewer new participants stepping in to “catch the dip.”
Retail Participation Has Faded
The chart shared by CryptoOnchain reportedly reveals that network participation among smaller, likely retail addresses began to weaken clearly in the second half of 2025. That decline has continued into early 2026, ultimately dragging active addresses back to 2020‑era lows.
This dynamic points to a familiar cycle in crypto markets: early speculative excitement gives way to exhaustion, disillusionment, and reduced engagement from casual investors. Many of the new entrants who appeared during the previous up‑moves might have either locked in profits, capitulated, or simply become inactive, leaving the market more heavily dependent on institutional flows, long‑term holders, and leveraged traders.
The consequence is a thinner, more fragile spot market. When retail interest fades, there are fewer small buyers to absorb sell pressure, and the market can begin to move largely on the actions of a relatively small set of players.
The $83,000 Breakdown As A “Fatal” Technical Event
Against this backdrop of weakening network fundamentals, the recent loss of support at $83,000 takes on added importance. According to CryptoOnchain, breaching that level may have been “fatal” for the current leg of the uptrend. The failure did not occur in a context of strengthening on‑chain activity; instead, price was already climbing on shaky footing.
The analyst argues that because Bitcoin’s rally above $80,000 was not backed by a corresponding surge in active addresses and network usage, the market was especially vulnerable. Once $83,000 gave way, the path of least resistance shifted decisively downward, with the lack of organic users amplifying the risk of an extended corrective phase rather than a quick V‑shaped recovery.
From a structural standpoint, this means the market may need to rebuild a stronger base of network demand before any new attempt at all‑time highs can be sustained.
Why Low Active Addresses Matter For Long‑Term Investors
For long‑term Bitcoin holders, active addresses are not just a short‑term trading signal; they are a proxy for adoption and real‑world usage. A healthy and growing network of transacting users tends to correlate with a more resilient asset, as it signals that Bitcoin is being held, transferred, and integrated into various economic activities beyond pure speculation.
When active addresses sink to multi‑year lows while price remains relatively elevated, it raises important questions:
– How many of today’s holders are committed long‑term users versus short‑term speculators?
– To what extent is price being driven by derivatives, leverage, or concentrated holdings rather than broad‑based demand?
– If volatility spikes, will there be enough genuine buyers to stabilize the market?
None of these questions automatically imply an imminent crash, but they do suggest that any recovery may require more than just favorable macro headlines or ETF inflows. Without a return of on‑chain engagement, rallies risk becoming increasingly fragile.
What Needs To Change For A Sustainable Recovery
CryptoOnchain is explicit about what must happen for Bitcoin to stage a durable rebound: the current phase of on‑chain inactivity needs to reverse. Simply bouncing in price is not enough; for upside moves to be more than temporary “bull traps,” the network must show signs of renewed life.
In practical terms, that means:
– A clear, sustained uptick in seven‑day active addresses
– Increased transaction counts and meaningful growth in fee revenue (a sign of genuine demand for block space)
– A rise in new addresses and reactivation of dormant wallets
– Broader participation, particularly from smaller and mid‑sized addresses, instead of only large entities
Only when these indicators begin to improve consistently can investors have more confidence that a new leg of the bull market is being built on solid foundations rather than speculation alone.
Possible Scenarios For The Months Ahead
Given the current data, several plausible scenarios emerge:
1. Extended Consolidation Or Grinding Downtrend
Bitcoin could continue to trade below the $83,000 zone, testing and retesting support levels such as $77,000, while network activity remains muted. In this case, price might drift lower or move sideways until macro conditions or a new catalyst brings users back on‑chain.
2. Sharp Capitulation Followed By Reaccumulation
If sell pressure intensifies without sufficient buyers, a sharper leg down could force a capitulation event. Historically, such moves sometimes flush out weak hands and set the stage for renewed accumulation, accompanied by rising active addresses and improving on‑chain metrics.
3. Gradual Rebuild Of Network Activity While Price Stabilizes
A more constructive scenario would see Bitcoin stabilize around current levels or slightly lower, while active addresses start to climb again. This would hint that new users and sidelined investors are slowly returning, creating a healthier platform for any future push above $83,000.
4. High‑Volatility “Bull Traps”
Without a clear improvement in network participation, Bitcoin might stage occasional sharp bounces that quickly fade. These so‑called bull traps can lure in late buyers before rolling over, causing further frustration and reinforcing cautious sentiment.
How Traders Might Use This Information
For short‑term traders and swing participants, the active address data can serve as a risk‑management tool rather than a precise timing signal. In an environment where network usage is at multi‑year lows, traders might:
– Treat bounces with skepticism unless they coincide with a visible uptick in on‑chain activity
– Be more conservative with leverage, recognizing that thin liquidity and weak organic demand can magnify both upside and downside moves
– Watch for divergences, such as price rising while active addresses keep falling, as potential warnings that a move lacks conviction
Conversely, if active addresses begin to recover while price is still depressed, that could indicate a more favorable backdrop for accumulating positions or taking on measured risk.
The Role Of Other On‑Chain Metrics
Active addresses are just one part of the broader on‑chain picture. Other metrics — such as the MVRV Z‑score, realized cap, dormancy, and various HODL wave indicators — can provide additional context about whether Bitcoin is closer to a cyclical top, bottom, or mid‑cycle consolidation.
Some analyses have suggested that certain valuation metrics are moving toward levels historically associated with the end of bear phases or major corrections. However, these signals work best when they align with improving network usage. A supportive on‑chain valuation environment combined with rising active addresses would be a stronger argument for renewed bullish momentum than valuation metrics alone.
Macro And Structural Drivers Behind The Slowdown
The collapse in active addresses does not exist in a vacuum. Several broader factors may be contributing to the current lull in activity:
– Macro uncertainty: Shifts in interest rate expectations, inflation concerns, and risk appetite can push both institutional and retail investors to the sidelines.
– Regulatory pressures: Ongoing regulatory debates and enforcement actions can dampen enthusiasm, especially among newcomers who are more sensitive to perceived legal risks.
– Market fatigue: After prolonged rallies, many participants experience “bull‑market exhaustion,” taking profits or disengaging until a clear new narrative emerges.
– Layer‑2 and off‑chain migration: Some activity may be moving to sidechains, payment channels, or custodial platforms, which can obscure usage that no longer shows up directly as on‑chain transactions.
Understanding these drivers can help investors judge whether the current slump in active addresses is likely to be temporary or part of a longer‑lasting structural shift.
What Long‑Term Holders Should Focus On
For those with a multi‑year horizon, the drop in active addresses is a reason for attentiveness, not necessarily panic. Historically, periods of low network engagement and negative sentiment have often preceded some of Bitcoin’s most powerful long‑term rallies, as they tend to coincide with undervaluation and the exit of speculative excess.
Key points for long‑term holders include:
– Monitoring whether addresses, transaction counts, and other adoption metrics begin to trend upward again over quarters, not just days.
– Paying attention to real‑world integrations of Bitcoin in payments, savings products, and institutional portfolios, which can eventually feed back into on‑chain activity.
– Maintaining realistic expectations about volatility: rebuilding a healthy market structure after a speculative run can take time and may involve further downside or prolonged sideways movement.
If Bitcoin’s fundamental story — as a scarce digital asset and alternative monetary system — remains intact, a temporary decline in usage can be viewed as part of the usual boom‑bust cycle rather than a terminal decline. The key is whether new cohorts of users and capital eventually replace those who have exited.
Current Market Snapshot
At the time of writing, Bitcoin is trading around $78,743, reflecting a daily loss of about 6.39% and a weekly drop exceeding 12%. Price is hovering above the critical $77,000 support zone, while the memory of the failed defense of $83,000 still weighs on sentiment.
With active addresses languishing at approximately 720,000 — the weakest reading since April 2020 — the market finds itself at a crossroads. Either network participation begins to recover, validating any upcoming price bounces and paving the way for a renewed push higher, or the divergence between price and usage persists, increasing the odds of deeper or more prolonged corrective action.
In the near term, the most important development to watch is not just where Bitcoin trades, but whether the network itself shows signs of waking back up. Only a “renewed influx of users on‑chain,” as CryptoOnchain emphasizes, can transform short‑lived rallies into the foundation for the next sustainable uptrend.