
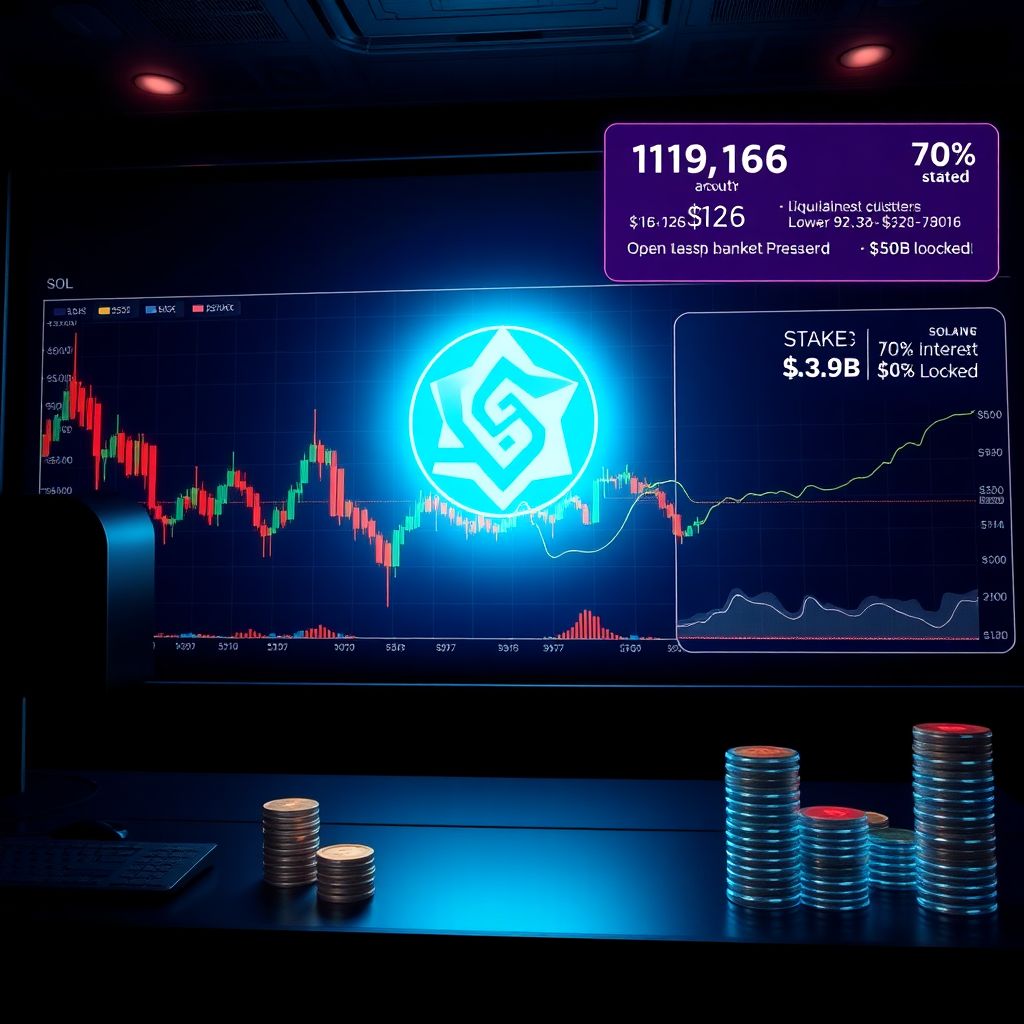
Solana tumbles 16% as staking hits record high: Can bulls protect the $126 zone?
Solana’s start to 2026 has flipped from optimism to stress in a matter of days. After kicking off the year with a powerful 20% upswing, the momentum reversed sharply on 25 January. The price was rejected below the key resistance near $145 and then slid almost 16%, sinking toward the $126 area and erasing much of the early-year gains.
That rejection at $145 did more than just trigger a pullback – it signaled a short-term trend shift. Bulls, who had been driving the rally since late December, lost control of the immediate structure as the market rotated back into previously tested support zones. The failure to break higher flipped sentiment quickly from “buy-the-dip” optimism to caution and, for some, outright fear of a deeper correction.
Liquidation clusters highlight near-term risk
Derivatives data paints a clear picture of where pain could concentrate next. Liquidation heatmaps show two prominent clusters: one in the $123–$126 band and another just above $130. These zones act like magnets for price action, as leveraged positions often get flushed out once price trades through them.
The existence of such dense liquidity zones on both sides of the current range keeps conditions unstable. Any weak relief bounce toward $130–$132 risks running into sell-side liquidations, where overleveraged long positions could be forced out, amplifying downward pressure. That dynamic makes traders hesitant to chase short-lived rallies without strong evidence of momentum returning to the upside.
Below the current range, stronger structural support appears in the $117–$119 region. If price gravitates toward that pocket, it will likely coincide with another round of liquidations and forced selling, potentially offering an area where spot buyers and patient bulls reassess the risk–reward.
Open interest climbs as price falls – a worrying mix
Futures market positioning adds another layer of concern. Open Interest (OI) has climbed from around $6.6 billion in late December to above $8.8 billion in January, even as Solana’s price has been trending lower. Typically, when OI rises while price also rises, it can reflect growing bullish conviction and fresh capital entering the market. Here, the opposite is happening.
The combination of rising OI and falling price often indicates that new positions are predominantly bearish. Short sellers appear to be stepping in aggressively, using the failed breakout at $145 as a trigger to lean into downside continuation. In that environment, every attempt at a bounce can be met with increased selling pressure from traders betting on further weakness.
This divergence between derivatives activity and spot price strength is rarely a positive signal for bulls. It suggests that the market’s weight is currently on the side of the bears, with leveraged traders positioning for more downside rather than an immediate reversal.
Staking reaches record highs despite the drawdown
While the price action looks fragile, on-chain metrics tell a contrasting story about investor conviction. Solana’s staking ratio has climbed to a record level of around 70%, with more than $60 billion worth of SOL locked in staking. Such a high proportion of the circulating supply being staked reflects strong confidence among long-term holders in the network’s prospects.
This isn’t the behavior of a market abandoning a project. High staking participation tends to reduce circulating supply on exchanges, which can, over time, decrease the immediate selling pressure. It also signals that many holders are willing to lock in their tokens for yield and network security rather than keeping them liquid for rapid speculation.
The surge in staking during a period of sharp price declines suggests that investors with a longer time horizon are using the weakness to double down on their exposure, seeing volatility as a temporary setback rather than a structural collapse. Fundamentally, this underpins Solana’s ecosystem with a committed base, even as short-term traders reposition.
Technical picture: Key levels to watch
From a technical standpoint, the loss of the $126 area has shifted market attention lower. Traders are now closely watching the $118–$119 support band, which aligns with a previous consolidation zone and a potential demand area where buyers may attempt to step in again.
If this zone fails to hold on a daily closing basis, the door opens to a more pronounced correction toward the $95–$98 range. That lower bracket coincides with an area where price previously found strong buying interest and could act as a deeper accumulation region for longer-term participants.
On the upside, the $145 level remains the line in the sand for bulls. A decisive reclaim of that resistance – confirmed by strong volume and follow-through – would be needed to argue for a sustained recovery, rather than just another short squeeze that quickly fades. Until that happens, price is likely to remain at the mercy of liquidity pockets and derivatives positioning.
What the bull and bear cases look like now
The bear case is straightforward: persistent selling pressure, rising open interest favoring shorts, and failed attempts to break above $130–$135 could drag SOL into a prolonged corrective phase. A breakdown of $118–$119 would likely accelerate this scenario, potentially sending price toward the $95–$98 support area where the next major battle between buyers and sellers might unfold.
The bull case is more nuanced. Bulls can point to several supportive factors: record staking participation, large amounts of SOL effectively removed from active circulation, and still-strong fundamentals across Solana’s ecosystem, including high throughput, active developers, and growing application usage. If price stabilizes above $118 and begins carving out a higher low, a base for recovery could form, especially if shorts become crowded and vulnerable to a squeeze.
In that scenario, a clean move back through $130, followed by a challenge and eventual break of $145, would be the roadmap for a more convincing trend reversal. For now, though, this remains a hypothesis rather than the prevailing reality.
How long-term holders might interpret the current drop
For longer-term participants, this drawdown can be viewed through a different lens than that of short-term traders. Sharp corrections are common in crypto bull cycles, and assets can drop 20–40% or more before resuming an overarching uptrend. Historically, such pullbacks often serve as re-accumulation phases for those with multi-year time horizons.
High staking rates and relatively muted panic from committed holders suggest that many of them see current levels as an opportunity rather than a definitive top. By locking in their coins, they not only earn rewards but also position themselves to benefit if the network’s growth story continues to play out in the coming years.
That said, conviction doesn’t erase risk. If macro conditions deteriorate or if the broader crypto market enters a deeper risk-off phase, even strong networks like Solana can suffer extended drawdowns. Long-term holders need to be aware that high volatility and long recovery periods are part of the landscape.
Short-term traders: Traps and opportunities
For active traders, the current environment is particularly treacherous. Price hovering around dense liquidation zones means intraday swings can be violent, with rapid wicks in both directions as leverage gets flushed from the system. Chasing these moves without a clear plan can lead to repeated stop-outs.
Traders often look for confirmation signals such as a sustained reclaim of a key level (for example, turning $126 from resistance back into support), a clear shift in funding rates, or a reduction in open interest after a washout event. These signs can indicate that the worst of the leverage build-up has been cleared and that the next move could be more directional and less chaotic.
On the downside, breakdowns below well-watched support levels – particularly if accompanied by surging volume – may present trend-following opportunities for those comfortable trading in alignment with the broader bearish pressure. In either direction, risk management is critical.
The role of macro and market-wide sentiment
Solana’s current price behavior does not exist in isolation. Broader crypto sentiment, movements in major assets like Bitcoin and Ethereum, and macroeconomic factors such as interest rate expectations and risk appetite in global markets all influence how aggressively capital flows into or out of altcoins.
If the wider market remains risk-averse, altcoins with high beta, like Solana, tend to experience amplified moves on both the upside and downside. That means SOL could continue to underperform during risk-off phases but also bounce more sharply once sentiment improves. Understanding this context can help explain why even technically strong setups sometimes fail when macro headwinds intensify.
Can bulls ultimately defend Solana?
In the immediate term, the question is whether bulls can slow or halt the bleeding around $118–$126. Defending this broad zone would not instantly restore the uptrend, but it would buy time for the market structure to reset and for short positioning to become overextended enough to fuel a counter-move.
Medium term, much depends on whether Solana continues to attract developers, users, and liquidity to its ecosystem. Record staking, steady on-chain activity, and growing infrastructure support the argument that the network remains one of the most significant players in the smart contract landscape. If that narrative remains intact, price corrections may eventually be seen as part of a longer growth trajectory rather than the start of a terminal decline.
Until then, SOL stays in a fragile position: fundamentally supported by strong holder conviction and network usage, yet technically pressured by leveraged shorts, failed resistance breaks, and an inability so far to reclaim the critical $145 level. How the price behaves around $118–$126 in the coming sessions will be crucial in determining whether this is just another deep pullback – or the beginning of a more extended downturn.
—
This analysis is for informational purposes only and should not be taken as financial or investment advice. Cryptocurrency markets are highly volatile, and anyone considering trading or investing should conduct their own research and evaluate their risk tolerance before making decisions.