
Why a “personal crypto command center” actually matters

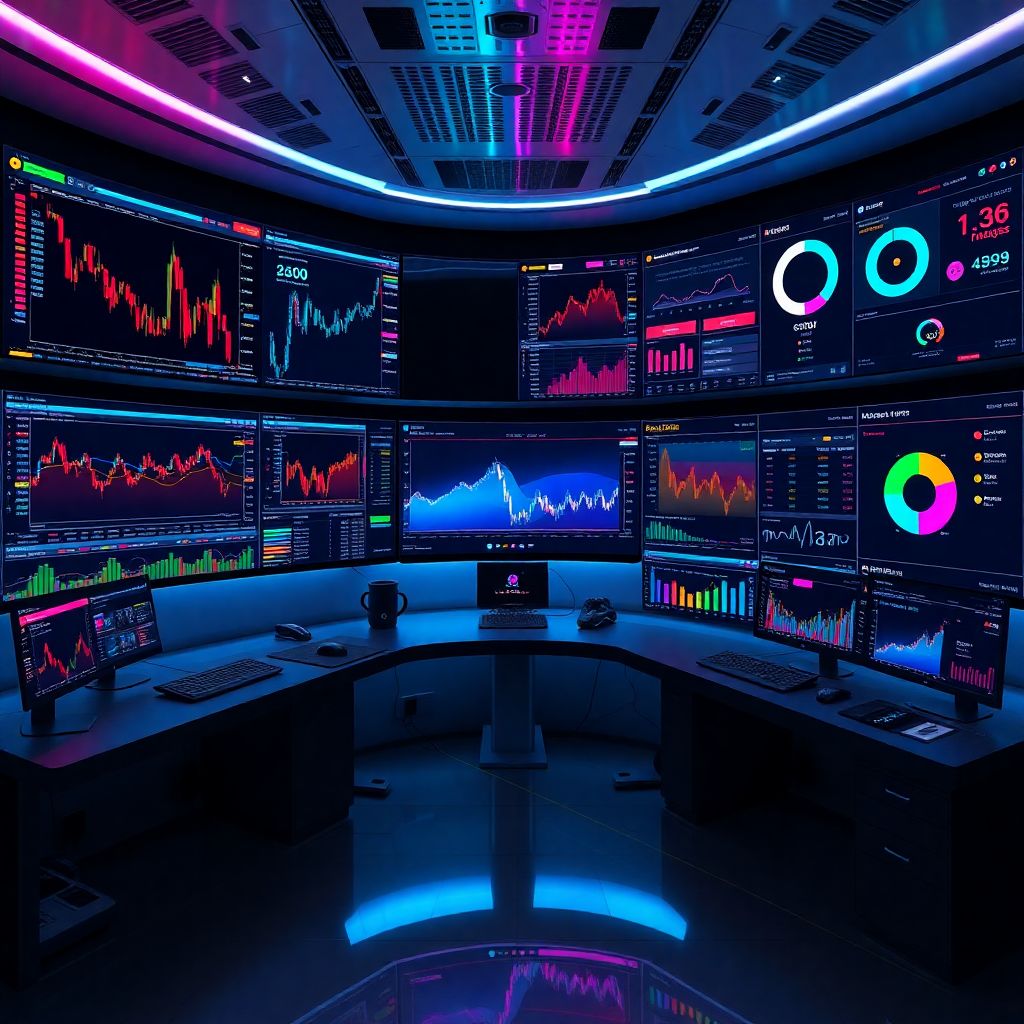
If you touch crypto more than once a week, you already know the pain: ten exchanges, five wallets, a stack of DeFi positions, a couple of bots, and no single place that tells you what’s going on. A personal crypto command center — your own dashboard setup — is how you turn this chaos into something you can actually manage and improve.
For traders and for investors this “command center” looks very different. Traders care about speed, precision and execution. Investors care about allocation, risk, and long‑term compounding. Try to use the same interface for both, and you’ll frustrate everyone. Let’s unpack how to design dashboards that actually match your style, instead of fighting it.
—
Traders vs investors: different questions, different dashboards
At a high level, traders ask “What should I do in the next minutes or hours?” Investors ask “Is my plan working over months and years?” That single difference drives everything about your dashboard.
Traders want a crypto portfolio dashboard for traders that surfaces three things instantly: current positions, current risk, current opportunity. Investors, by contrast, need a calm, slower‑moving view: net worth over time, allocation by sector and chain, and whether they’re on track to hit their targets. If your primary question is “What’s my PnL today and where’s my edge right now?” you’re a trader in dashboard terms, even if you think of yourself as a “long‑term” person.
—
Core building blocks of a trader dashboard
A trader‑centric layout is all about live data and fast decisions. You want to minimize clicks between idea → order → risk check. A typical layout might look like this:
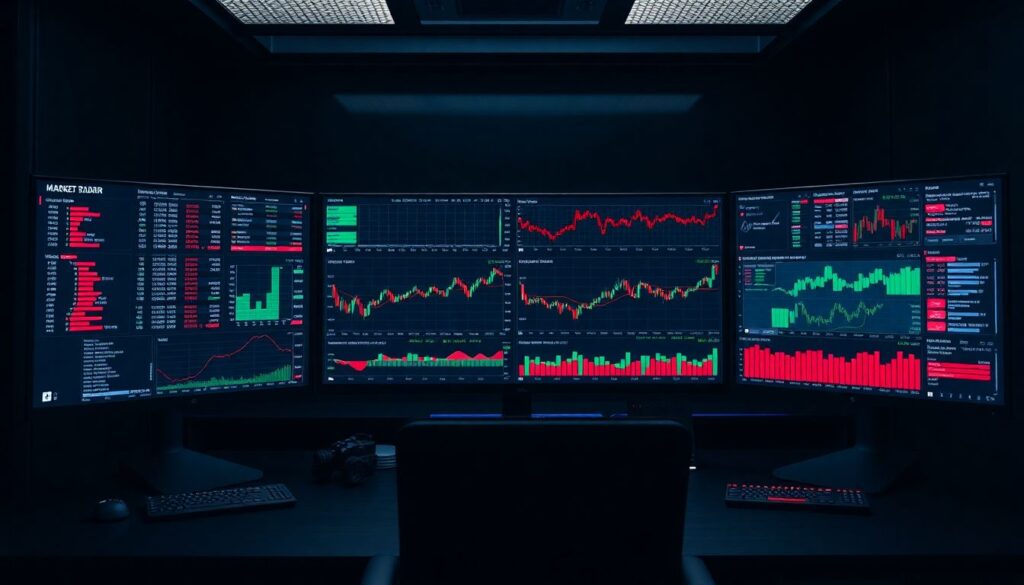
1. Market radar
– Watchlists with live prices, spreads, and 24h volume
– Heatmaps by sector, chain, or volatility
– Top gainers/losers filtered to your traded pairs
2. Execution panel
– Order book, recent trades, depth chart
– One‑click or hotkey trading connected to your main exchanges
– Position sizing helpers: % of equity, fixed risk in USDT, etc.
3. Real‑time PnL and risk
– Open positions, entry, liquidation prices, unrealized PnL
– Account margin usage across exchanges
– Alerts on leverage, drawdown, and anomalous slippage
4. Strategy metrics
– Win rate, average R multiple, maximum drawdown
– Breakdown by setup: breakout, mean reversion, news, etc.
The important part: every element should influence behavior in the next few hours, not next year. If a widget doesn’t change your trading decisions intraday, push it off to a secondary screen or to your investor dashboard.
—
What investors actually need to see
Investors live in another rhythm. They don’t need five‑second updates; they need clarity and context. A solid crypto analytics dashboard for investors answers questions like: “How concentrated am I?” “What’s my true risk?” “Is my thesis outperforming just buying BTC and doing nothing?”
A good layout often includes:
– Total portfolio curve over months and years, including deposits/withdrawals.
– Allocation views by asset, sector (L1s, DeFi, infra, gaming), chain, and risk bucket.
– Benchmark comparison: vs BTC, ETH, a simple index, or a stablecoin baseline.
– Yield and cash‑flow tracking: staking, lending, restaking, airdrops, and locked positions.
– Tax and compliance hints: realized gains by period, holding periods for long‑term vs short‑term.
This is where a crypto investment tracking dashboard software really shines: it handles historical data, cost basis, and multi‑year reporting so you don’t have to live in spreadsheets forever.
—
Approach #1: All‑in‑one hosted tools
The quickest way to get started is with hosted platforms — the best crypto trading dashboard tools that connect directly to your exchanges and wallets via API and public addresses. Think “log in, connect accounts, see charts.”
They’re ideal if you:
– Don’t want to maintain infrastructure.
– Are okay with their default layouts and data models.
– Trade or invest at a scale where a short outage isn’t catastrophic.
The upside: fast setup, polished UI, built‑in integrations, mobile apps, alerts. The downside: less customization, potential data‑privacy concerns (you’re handing over read‑only keys), and you’re locked into their feature roadmap.
—
Approach #2: DIY using no‑code + APIs
If you’re picky about your layout but not a full‑time developer, a hybrid approach works well: use exchange APIs + on‑chain indexers + a BI tool or no‑code dashboard builder. You stitch together your own crypto portfolio dashboard for traders or investors without writing thousands of lines of code.
Typical stack:
– Exchange and broker APIs for positions and trades.
– On‑chain data providers (Etherscan‑style APIs, Subgraphs, Dune/BQ exports).
– A dashboard tool (Notion with embeds, Retool, Power BI, Metabase, or a similar product).
This works nicely for power users who are okay spending a weekend wiring things up in exchange for getting exactly the views they want.
—
Approach #3: Fully custom platform for pros
If you manage external capital or run systematic strategies, you’ll quickly hit the ceiling of off‑the‑shelf products. That’s where a custom cryptocurrency portfolio management platform comes in: you control the data model, the pipelines, and the exact interface your team stares at all day.
Pros:
– Maximum flexibility: custom risk metrics, latency‑optimized feeds, bespoke reports.
– Security: you choose how and where data is stored, what’s air‑gapped, and what’s online.
– Integration: plug in bots, risk engines, backtesters, and compliance tools seamlessly.
Cons:
– Higher cost in engineering time and maintenance.
– You’re responsible for uptime, bugfixes, and data correctness.
For most serious trading desks, this is not a “nice‑to‑have” — it’s part of their edge.
—
Pros and cons of key technologies (in plain English)
Instead of listing every possible tool, think in buckets:
– Centralized exchange APIs
– + Stable, rich data for orders, trades, balances.
– − Limited historical depth, rate limits, vendor lock‑in.
– On‑chain data via nodes/indexers
– + Verifiable, composable, covers DeFi, NFTs, airdrops.
– − Harder to normalize; raw data is noisy and sometimes expensive to query at scale.
– Web‑based dashboard apps
– + Accessible anywhere, easy to share with team or accountant.
– − Reliant on third‑party uptime, potential latency issues during peak volatility.
– Desktop or self‑hosted software
– + More control, better for sensitive data and serious automation.
– − Requires updates, DevOps, and backups; more to break.
Match the tech to your risk tolerance, not just to your budget.
—
Designing a trader‑first command center: a practical recipe
Here’s one concrete way to build a practical trading setup that actually helps you pull the trigger:
1. Pick one “truth source” for positions
Connect your main exchanges and margin accounts to a single view. Avoid having to mentally sum PnL across four platforms in your head.
2. Define 3–5 core metrics you care about
For example: total open risk (in % account), intraday realized PnL, max per‑trade loss, daily drawdown, and open leverage. Design the layout so you can see them at a glance without scrolling.
3. Limit information per screen
One monitor (or virtual workspace) for market discovery, one for execution and orders, one for risk and PnL. Overcrowded dashboards lead to hesitation.
4. Wire in alerts, not just visuals
Price and volume alerts, but also risk alerts: “position size > X% of equity,” “account drawdown > Y% for the day.” Your dashboard shouldn’t just show trouble; it should yell when trouble appears.
5. Backtest your layout with real sessions
After a week, review trade logs. For every mistake, ask: “Could my dashboard have prevented this?” Then tweak: add a widget, remove noise, rearrange panels.
The trader’s command center is a living thing. If it doesn’t adapt with your edge, it will start working against you.
—
Building an investor‑grade dashboard that keeps you honest
Investors need their own workflow. Your goal is not to trade better today but to stick to your plan over hundreds of days. That calls for more structure and less adrenaline.
Focus on these elements:
– Clear target allocations by asset and category.
– Automatically updated actual allocations versus targets.
– A simple rebalance signal: “Off target by more than X%.”
– Rolling performance vs benchmarks over 1M, 3M, 1Y, and since inception.
– Tax‑relevant views: realized vs unrealized gains, lot‑level holding periods.
If you use crypto investment tracking dashboard software, make sure it handles: multiple wallets, multiple chains, DeFi positions, and historical cost basis. You don’t want to reconstruct all this during tax season with screenshots and guesswork.
—
Choosing the right tools: practical recommendations
Use a “minimum effective complexity” rule: choose the *simplest* stack that solves your actual problems.
For most people:
1. If you’re primarily a discretionary trader:
Start with a robust exchange‑connected app that offers consolidated positions, PnL, and basic risk metrics. Add one separate analytics or journaling layer for strategy stats. Resist the urge to plug into ten data sources “just because.”
2. If you’re mostly a long‑term investor:
Prioritize reliable portfolio and tax tracking, plus benchmark comparison. You can live with 15‑minute delayed data, but not with missing historical transactions.
3. If you split between trading and investing:
Consider two dashboards: one “noisy,” one “quiet.” The trading view lives on your main monitor. The investor view you open weekly or monthly, not every time you feel FOMO.
4. If you manage external capital or run bots:
Budget for engineering from day one and move toward your own infrastructure, even if you start on top of existing services. Your risk is not just markets; it’s also vendor failures and data errors.
The test: can you explain your setup and why you chose each piece in under two minutes? If not, it’s probably too complex.
—
Trends to watch in 2025 when designing dashboards
As of 2025, several trends are changing how these command centers look and behave:
– On‑chain identity and unified profiles
More tools are aggregating all your addresses, ENS, and even CEX accounts into a single identity, so dashboards can auto‑discover assets instead of you typing every wallet.
– AI‑assisted analytics and anomaly detection
Instead of manually hunting for odd patterns, dashboards increasingly flag “unusual” behavior — fee spikes, slippage anomalies, unexpected exposure to a protocol or chain — and summarize it in plain language.
– DeFi and CeFi convergence
Hybrid platforms now show perpetuals, option positions, DeFi lending, and restaking yields in a single pane. This blurs the old line between trading terminals and portfolio tools.
– Scenario and stress testing
More advanced dashboards simulate “What if BTC drops 20%?” or “What if gas fees 5x?” on your positions. This is moving from hedge‑fund‑only territory into serious retail tools.
– Regulatory and tax‑first features
With more jurisdictions tightening rules, dashboards are adding automated compliance hints: wash‑trade warnings, travel‑rule compatibility checks, and exportable audit trails for accountants.
If you’re setting up a new system now, choose platforms that clearly invest in these areas. You don’t want to migrate everything in 18 months because your current tools can’t keep up.
—
Putting it all together: build your command center step by step
Don’t try to build a perfect system in one weekend. Instead:
1. Start with your primary role: trader, investor, or hybrid.
2. Write down your top 5 questions you want answered in under 10 seconds.
3. Pick a base tool (hosted, no‑code, or custom) that answers those questions with minimal friction.
4. Add integrations slowly, only when they unlock new, specific decisions.
5. Review quarterly: prune unused widgets, update metrics, and re‑align the layout with how you actually operate today.
Your personal crypto command center is not a vanity project; it’s part of your edge. Designed well, it frees up mental bandwidth so you can focus on the one thing that actually moves your PnL over time: making better decisions, not clicking through more tabs.