
Why Everyone Suddenly Cares About ETF-Linked Wallets
If you feel that “ETF-linked wallets” went from nerdy niche to daily headline in a year, you’re not wrong. Once spot Bitcoin ETFs launched in the US and then started popping up in other jurisdictions, traders realized something: every ETF share is backed by coins sitting in very real, traceable blockchain addresses. Those addresses belong to custodians and authorized participants, and their activity can now be watched almost tick-by-tick. As soon as ETF wallet tracking tools became more polished, the crypto crowd began staring at custodian wallets like they once stared at BitMEX funding or Mt.Gox cold storage. The big question that emerged: if we can watch these flows live, do they actually move the market — or just our emotions?
Key Terms Without the Jargon Fog
To understand what’s going on, it helps to agree on a few basic definitions. An “ETF-linked wallet” is any blockchain address or cluster of addresses that can be reasonably attributed to a specific crypto ETF or its custodian. That includes deep cold storage, warm wallets used for rebalancing, and operational wallets moving collateral in and out. A “custodian” is the regulated entity (think Coinbase Custody, Fidelity, etc.) that actually holds the coins backing the ETF shares. Most of them operate complex internal systems, but some of their vault addresses are traceable on-chain, especially when issuers or regulators disclose partial information, or when consistent transaction patterns give them away through on-chain heuristics.
Real-Time Monitoring vs Old-School End-of-Day Reports
In traditional finance, ETF flows are mostly visible through end-of-day creation/redemption data and delayed holdings reports. In crypto, we can go further: a real-time crypto ETF monitoring platform can ingest every on-chain transaction going through known custodian clusters and correlate it with trading volumes on exchanges. That’s real-time monitoring: continuously scanning block data, classifying movements (inflows, outflows, internal reshuffles), and mapping them to ETF activity. The main difference from old-school reporting is latency. You’re no longer waiting for a PDF; you’re watching coins move on-chain in minutes or even seconds after each block, which tempts traders to react faster — sometimes too fast.
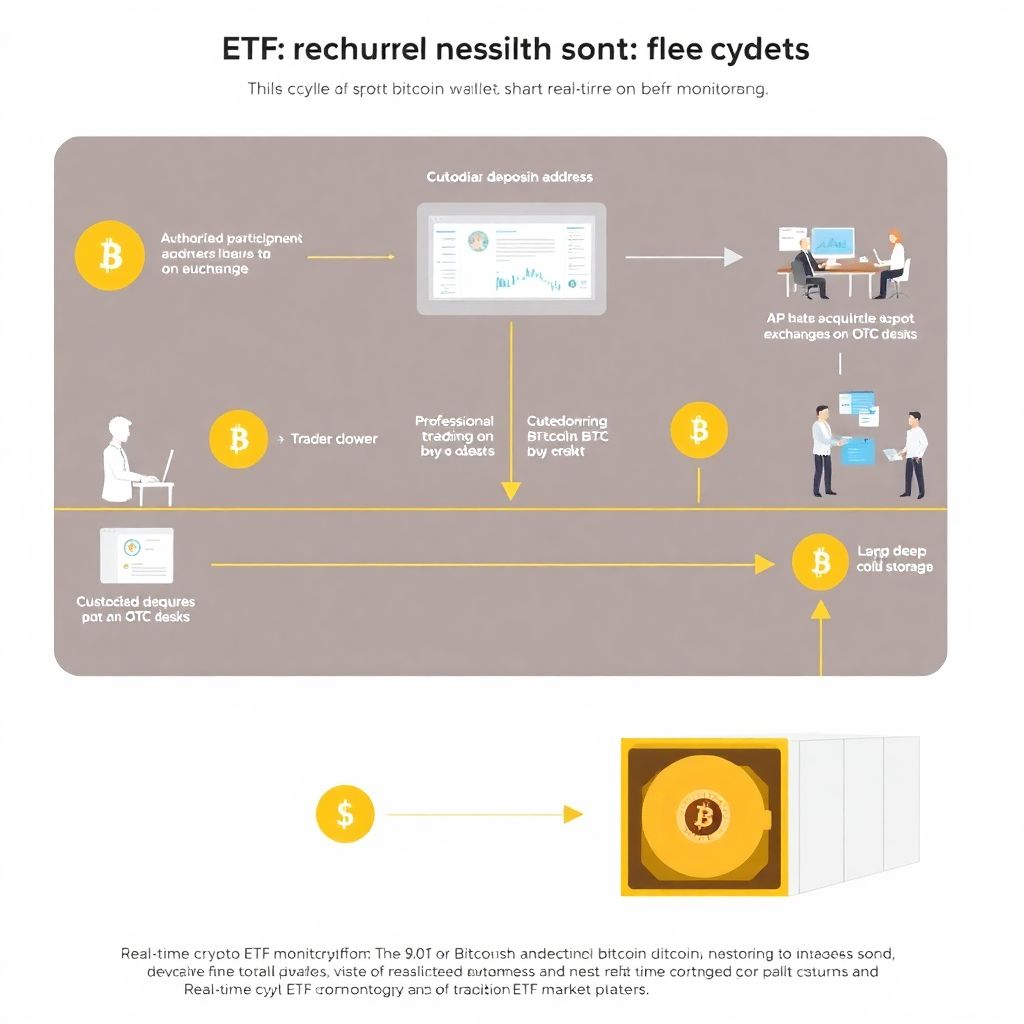
How On-Chain ETF Tracking Actually Works
Let’s strip away the magic. Under the hood, most ETF tracking systems rely on address clustering, heuristics, and a ton of labeling work. First, they identify known custodian deposit and withdrawal addresses from exchange records, issuers’ disclosures, or chain analytics providers. Next, they cluster these addresses using transaction graph analysis — for example, if multiple addresses repeatedly sweep funds into a single vault address with consistent patterns, they’re likely part of the same wallet infrastructure. Then they track balance changes of that whole cluster over time, rather than just one address. Finally, they overlay that with ETF share creations and redemptions from traditional market data feeds. When you see an ETF’s AUM jump 5% and, at the same time, a linked custodian cluster’s balance grows by the same amount, you gain confidence that you’ve mapped the wallets correctly.
Textual Diagram: From ETF Share to On-Chain Coins
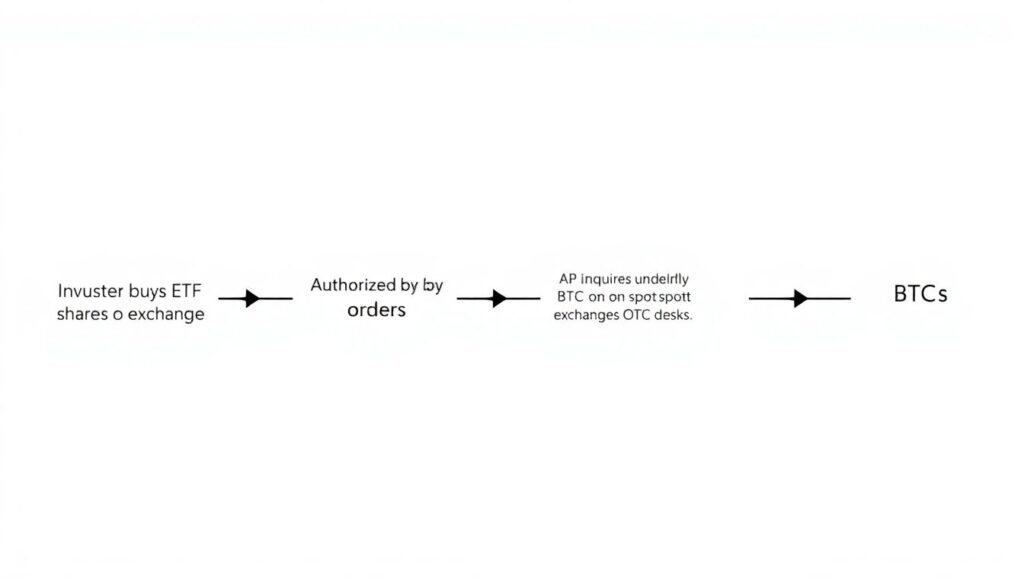
Imagine a simple horizontal flow as a text diagram. On the left, you have “Investor buys ETF shares on exchange.” From there, an arrow goes to “Authorized participant aggregates buy orders,” which then points to “AP acquires underlying BTC on spot exchanges or OTC desks.” Next arrow points to “BTC sent to custodian deposit address (wallet cluster A),” and from there to “Custodian consolidates into deep cold storage (wallet cluster B).” Over this entire pipeline, a monitoring system sits as a vertical layer, listening to trading data from the ETF and blockchain events from wallet clusters A and B. When the balance of cluster B rises, the system annotates it as “likely ETF inflow,” cross-checking against creation data. This mental diagram helps explain why tracking is probabilistic: you’re correlating multiple imperfect signals, not reading a single official “ETF wallet” tag on the chain.
Where ETF Wallet Tracking Differs From Whale Watching
At first glance, “watching ETF wallets” sounds like regular whale watching, just with fancier logos. But the dynamics are different in a few important ways. A random whale moving 5,000 BTC to an exchange can be interpreted as almost anything — a sell, a transfer between venues, collateral reshuffling, or just paranoia. By contrast, ETF-linked flows have strong structural constraints: issuers must keep the ETF fully backed; custodians usually operate under strict procedures; and creation/redemption mechanisms tie on-chain flows to regulated products. This is why specialized on-chain analytics for ETF custodians gained traction: understanding regulated, rule-driven flows is easier than guessing what a private billionaire might do on a Sunday night. At the same time, ETF activity is often net-directional over medium horizons — persistent inflows or outflows — which can amplify or dampen broader market trends in more predictable ways.
Case Study #1: The “ETF Inflow Spike” That Didn’t Pump the Market
Let’s look at a realistic composite case drawn from early spot Bitcoin ETF trading. Picture a Monday morning where an analytics firm tweets a chart: ETF custodian wallets have received 12,000 BTC over the past 24 hours, the largest single-day inflow since launch. Social media erupts with claims that the market “must” go up. Yet spot BTC only rises 1–2%, then chops sideways. What happened? Behind the scenes, authorized participants had been pre-hedging all week, quietly buying BTC across multiple venues in anticipation of strong ETF demand. By the time those coins finally moved into custodian wallets — the on-chain event everyone saw — the actual buying pressure was mostly spent. The visible “inflow spike” was settlement, not fresh demand. In this case, real-time wallet tracking looked impressive, but most of the actionable information was in off-chain order books days earlier, not in the ultimate custodian transfer.
When Real-Time Tracking Does Move the Needle
Still, there are cases where watching ETF-linked wallets can give traders a true edge. Consider days when equity markets are closed or illiquid, but crypto trades 24/7. An overseas ETF might see outsized creations during its local trading session, while US-based derivatives markets are thin. If, around the same time, you notice large, unusually fast inflows into that ETF’s custodian wallets, you can infer a real, present imbalance between structured-product demand and spot supply. In such windows, ETF flows aren’t fully hedged yet; trading desks may be scrambling to source coins. Here, rapid wallet monitoring can expose short-term dislocations in basis between ETF prices, spot prices, and futures, and high-frequency funds might deploy crypto market impact analysis software to quantify how many basis points of slippage this flow could cause in thin order books.
Case Study #2: Asia-Listed ETF and the Weekend Liquidity Squeeze
Take a scenario loosely inspired by the first months of Asia-listed Bitcoin ETFs. On a Friday, local retail demand surges due to a wave of bullish headlines. Market makers issue new ETF shares aggressively, but global spot liquidity is already stretched. The desk buys BTC during Asian hours, but full settlement into the custodian doesn’t finish until late Saturday on-chain. An analytics firm’s dashboards light up: custodian clusters show an abrupt 8,000 BTC inflow in a low-liquidity weekend environment. A few quant funds, watching this via a real-time crypto ETF monitoring platform, notice that funding rates on perpetual futures are still relatively tame while spot prices begin grinding higher. They infer that some of the buying pressure is not fully hedged and that any additional positive news could trigger a sharper squeeze. These funds front-run further ETF-driven demand across major exchanges, pushing prices up more than they might have moved without this transparent signal.
Diagram in Words: Feedback Loop From Wallets to Market
Visualize another mental diagram, this time as a loop. Start with “ETF inflows rise,” arrow to “Custodian wallet balances increase,” arrow to “On-chain trackers show large, visible inflows.” From there, arrow goes to “Traders interpret this as bullish signal and buy spot/futures,” which feeds into “Spot price rises.” That in turn can loop back to “Attracts more retail interest in the ETF,” and the cycle repeats. The key insight is that the on-chain signal itself becomes part of the narrative traders react to. This feedback loop can amplify modest fundamental flows into outsized price swings if market participants over-weight the wallet data. Conversely, if desks and investors grow more sophisticated, they discount “old news” settlement flows and focus only on truly unexpected wallet moves that imply real-time order flow shifts.
Comparing ETF Wallet Analytics With Other On-Chain Signals
How does ETF-focused monitoring stack against other popular crypto signals like exchange reserves, stablecoin mint/burn activity, or DeFi TVL changes? Each has its pain points. Exchange reserve tracking is notoriously noisy: internal reshuffles, new hot wallets, or proof-of-reserves rituals can create big jumps that mean nothing. Stablecoin flows are powerful but often ambiguous without context — a big mint could be market-making inventory, not new retail money. DeFi metrics are slower-moving and deeply tied to rate environments. By contrast, blockchain data analytics for institutional investors that focus on ETF-linked wallets usually deal with fewer, better-understood actors, operating under regulatory disclosure rules. That makes these flows cleaner, but also narrower: they cover a specific subset of capital — regulated ETF money — rather than the entire speculative ecosystem. Used alone, they’re insufficient; used as one layer in a broader mosaic of indicators, they’re extremely valuable.
Do These Tools Give Retail Traders a Fair Shot?
One underrated aspect is accessibility. In the early days, only big funds had internal tools to track custodial flows in real time. Today, several dashboards offer public or low-cost access to ETF-related metrics, basically turning complex infrastructure into semi-democratized ETF wallet tracking tools. Does that level the playing field? Partially. Retail still competes against funds that co-locate servers, run smart order routing, and plug wallet signals into full-fledged trading engines. But at least the raw information — that 10,000 BTC just moved into a specific custodian cluster — is no longer exclusive. The real gap is now in interpretation: professionals understand when a transfer is likely pre-hedged or operational noise, while many retail traders treat every spike as a “breaking news” event, sometimes buying tops created by their own excited reaction.
Case Study #3: False Alarm From Custodian Maintenance
Consider a Sunday where a major custodian announces a backend migration in obscure technical documentation but not on social media. They move a huge chunk of ETF collateral from older cold storage addresses to a new, upgraded vault setup. On-chain, it looks insane: 30,000 BTC flowing out of known ETF-linked wallets into freshly generated addresses. Within minutes, social media posts speculate about “mass redemptions,” “issuer risk,” or “regulatory crackdown.” Prices wobble as some traders panic-sell. A few hours later, the custodian’s official X account clarifies that all funds are safe and this was a planned migration. Professional desks, armed with more nuanced on-chain analytics for ETF custodians and backchannel knowledge, had already noticed that coins never touched deposit addresses on exchanges and that transaction patterns matched past maintenance windows. They stayed calm, or even faded the panic for profit, while latecomers learned how easily misinterpreted wallet data can become a self-inflicted volatility event.
How Institutions Really Use ETF Wallet Data
From the institutional side, ETF wallet flows are rarely a standalone “buy/sell” button. Instead, they’re one feature among many in sophisticated risk and execution stacks. For instance, a macro fund might feed custodian wallet balances into its factor models to better understand structural demand for Bitcoin-related exposure over weeks and months. A market-making desk could use short-horizon inflow data to adjust their inventory targets, staying ahead of predictable creation spikes around options expiries or index rebalances. And a risk team might watch for abnormal outflows from a single custodian as an early warning of counterparty or reputational risk. All of this sits alongside other components of blockchain data analytics for institutional investors: exchange flows, DeFi collateral changes, OTC block-trade footprints, funding rates, and volatility surfaces. Wallet data isn’t a crystal ball; it’s one more lens for seeing how ETF demand interacts with the broader liquidity landscape.
Software Stack: From Raw Blocks to Actionable Alerts
Underneath, the tech stack powering this kind of monitoring is nontrivial. A typical setup starts with node infrastructure or third-party block data feeds, streaming new blocks and mempool transactions. These are ingested into a pipeline that normalizes and tags transactions, mapping known addresses to entities like custodians, exchanges, or OTC desks. On top of that, analytics logic classifies events into categories: “potential ETF creation,” “likely redemption,” “internal sweep,” and so on, often using probabilistic models. Finally, an alerting layer triggers notifications or dashboards when certain thresholds are hit — for example, a rolling 24-hour inflow exceeding a historical percentile. To the end user it looks like a clean chart with annotations, but behind it sits infrastructure not unlike what’s found in high-end crypto market impact analysis software, with real-time compute, historical backtesting, and risk-aware alerting.
So… Does Real-Time Monitoring Actually Move the Market?
The honest answer is: sometimes directly, often indirectly, and occasionally not at all. Direct impact appears when wallet flows reveal truly new information that the market hasn’t priced in — such as unexpected, large creation waves in illiquid conditions. Indirect impact happens when these flows feed narratives and sentiment: traders see big ETF inflows, tweet bullish charts, and attract more buyers, which then pushes prices. In many other cases, though, wallet activity mostly reflects already completed trades or operational housekeeping, adding color rather than fresh signal. The more people understand this nuance, the less likely each spike is to cause wild overreactions. Over time, as markets adapt, the informational edge of simple “watch the custodian address” strategies will likely shrink, and value will come from combining ETF data with deeper context: who’s buying, how they hedge, and where liquidity is truly thin.
Practical Takeaways for Traders and Builders
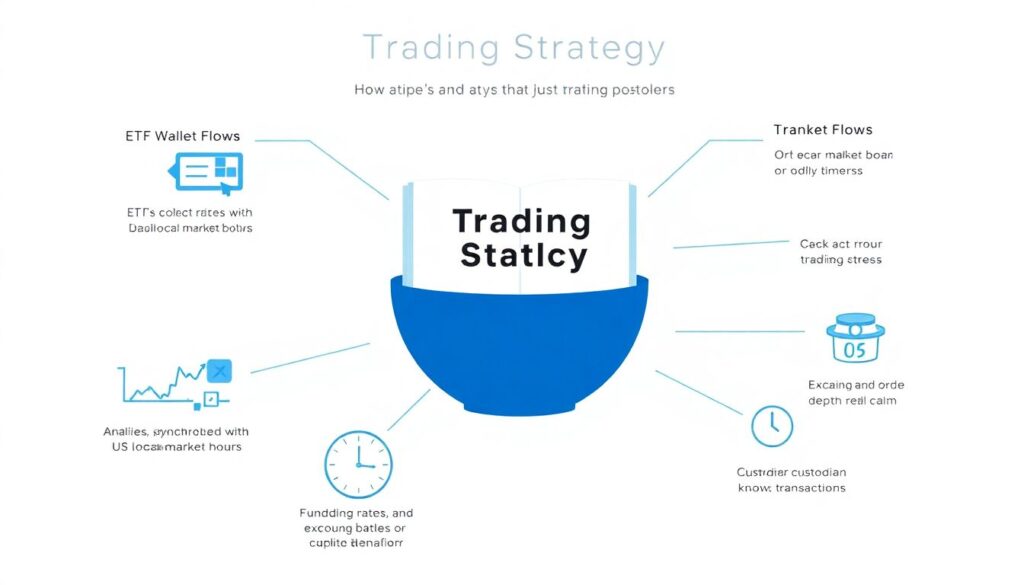
If you’re trading on these signals, treat ETF wallet flows as one ingredient, not the entire recipe. Ask: is this flow synchronized with US or local market hours, or oddly timed? Do funding rates, basis, and exchange order books confirm real stress, or look calm? Is the custodian known to batch transactions periodically, which could create misleading spikes? Also, pay attention to communication channels: custodians increasingly pre-announce major structural moves to avoid unnecessary panic. For builders, the opportunity lies in better interpretation layers: not just “big inflow” alerts, but nuanced context explaining whether this is likely settlement, hedging, or genuinely fresh demand. As tools mature, the best ETF wallet tracking tools won’t be the loudest; they’ll be the ones that quietly help users separate real signal from the vivid, but often misleading, noise of every large on-chain transfer tied to the ETF ecosystem.