
Analyst Sees Chance For 430% PEPE Price Surge – But Only If This Key Level Holds
The memecoin PEPE has been one of the biggest casualties of the crypto market crash that unfolded from October 2025. Among the major meme coins, PEPE’s decline has been particularly harsh: its value has dropped by more than 50% from pre-crash levels, erasing a large portion of investor gains and confidence.
Despite this steep correction, some market analysts argue that the worst may now be over. One of them, crypto analyst MMBTtrader, believes PEPE could be nearing a crucial turning point. According to their technical outlook, the coin may be in the process of forming a long-term bottom, opening the door to a potential rebound of up to 430%—provided a specific price zone continues to hold.
PEPE’s Deep Drawdown Sets the Stage
Data from market trackers shows that PEPE has lost around 41% of its value in the last 30 days alone, pushing the price dangerously close to the $0.000004 region. This drawdown comes on top of broader losses since October 2025, when the wider crypto market entered a sharp, liquidity-driven sell-off.
For PEPE, this correction has dragged the token back to levels not seen in over a year. Such revisits of old price zones are often interpreted by technical traders as potential accumulation areas, where long-term participants quietly build positions while short-term traders capitulate.
Bottom Formation: What the Analyst Is Seeing
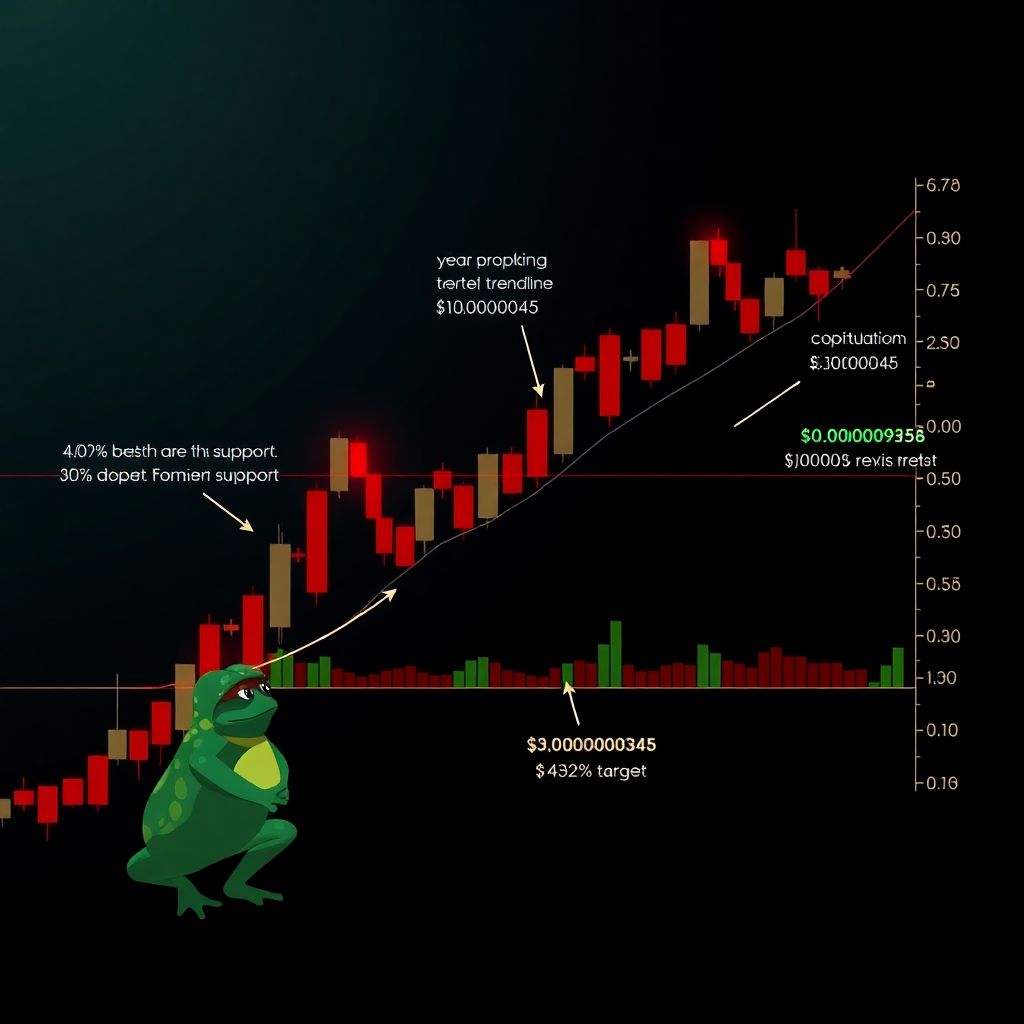
In the analysis shared by MMBTtrader, the current PEPE structure is described as the tail end of a long, year‑long bearish phase. The key technical development is that PEPE has dropped below an important daily support level around $0.0000045.
This level had acted as a floor for price action for months. Once broken, the coin moved back to “retest” the trendline that had been intact since May 2025. In classical technical analysis, such a retest is often a make‑or‑break moment: the market decides whether the former support becomes resistance, or whether the move below was a temporary “fakeout” before a stronger reversal.
MMBTtrader suggests that PEPE is now interacting with this descending trendline in a way that could signal exhaustion of selling pressure. If price reacts positively at this area—meaning sellers fail to push it decisively lower and buyers step in with volume—it could confirm that a bottom is in or forming.
From Resistance to Support: The Critical Level
The thesis hinges on a classic market dynamic: once a trendline or horizontal level is broken, it can switch roles. What used to be support can become resistance, and vice versa.
According to the analyst, if the price is “rejected” from the descending trendline—that is, if it attempts to break below but is pushed back up—it could indicate that this zone is now turning into support again. That shift would be a strong bullish signal, implying that the market has digested the worst of the sell-off and is ready to start a new upward leg.
In practical terms, traders will be watching how PEPE behaves around the $0.000004–$0.0000045 range. Sustained trading above this area, with higher lows forming on the chart, would strengthen the case for a trend reversal. A clean breakdown below it with strong volume, on the other hand, would invalidate or at least delay the bullish scenario.
A 430% Upside Target – How the Analyst Gets There
If the bullish case plays out, MMBTtrader projects a possible 430% rally from the current depressed levels. That would place PEPE near $0.000022 sometime in 2026, bringing it within striking distance of its historical all‑time highs.
This target is typically derived from measuring previous impulse waves and applying them to the new potential uptrend, or by projecting moves from key support and resistance ranges. The idea is that once a major bottom forms, the following rally can often be proportionate to earlier cycles in the asset’s trading history.
However, the path to $0.000022 is not expected to be smooth. The analyst points out two strong resistance zones that PEPE would likely have to overcome on the way up:
– Around $0.00000958 – the first major ceiling where many short‑term holders could take profits or exit breakeven.
– Around $0.00001340 – a second, higher barrier that historically attracted heavy selling and could again limit upside on initial attempts.
Only a sustained break above both these levels, ideally accompanied by rising volume and improving market sentiment, would validate the full 430% rally scenario.
Why a Bottom Could Be Forming Now
Several technical and behavioral factors typically converge near a bottom, and PEPE’s recent action exhibits some of them:
1. Extended Downtrend Duration
PEPE has been in a bearish structure for roughly a year. Prolonged declines often compress volatility and exhaust sellers over time, making it harder for bears to push price significantly lower without fresh negative catalysts.
2. Retest of Long-Term Trendline
The retest of the May 2025 trendline is significant. Long-term trendlines tend to attract institutional and higher‑timeframe traders who base decisions on weekly or daily charts, not intraday noise. A defended retest here can mark the beginning of a structural shift.
3. Capitulation‑Like Moves
Sharp 30‑day drops of 40%+ often coincide with late‑stage fear selling, liquidations, and emotionally driven exits. While painful, such moves can also clear out weak hands and reset the market for a more sustainable rally.
4. Memecoin Cycles
Meme coins are notoriously cyclical, swinging between euphoric rallies and brutal corrections. Once a major portion of speculative capital has left, a smaller base of committed holders and opportunistic new buyers can support a new cycle—especially if broader market conditions improve.
Risks That Could Invalidate the Bullish Scenario
While the upside potential looks attractive on paper, there are substantial risks that traders and investors must weigh:
– Break Below $0.000004
A decisive drop below the current key level, especially if accompanied by increasing volume, would suggest the bottom is not yet in. The market could then seek lower liquidity pockets, potentially leading to another leg down.
– Macro and Bitcoin Correlation
Memecoins tend to correlate with Bitcoin and general risk appetite in the crypto space. If Bitcoin continues to struggle or enters a deeper bear market—such as slipping further below major round levels like 90,000–100,000 USD—it could drag PEPE and other altcoins with it.
– Sentiment Shifts Around Meme Coins
Investor interest in meme coins can fade quickly. If capital rotates aggressively into more “serious” sectors like AI, infrastructure, or real‑world assets, PEPE may struggle to attract enough speculative flow to sustain a large multi‑hundred‑percent rally.
– Regulatory or Exchange‑Related Shocks
Any restrictions, delistings, or changes in trading conditions for high‑risk tokens could hit memecoins particularly hard and derail technical setups, no matter how promising they look on the chart.
How Traders Might Approach This Setup
For active traders considering PEPE based on this analysis, risk management is crucial. Some possible approaches include:
– Waiting for Confirmation
Instead of trying to “catch the exact bottom,” many traders prefer to wait for confirmation: a clear bounce from the $0.000004–$0.0000045 zone, formation of higher lows, and a break back above short‑term resistance levels.
– Watching Volume and Momentum Indicators
Indicators such as RSI, MACD, or moving averages can help gauge whether momentum is actually reversing or merely pausing during a broader downtrend. A bottom is more convincing when price strength is backed by rising volume and improving momentum.
– Scaling In Rather Than Going All‑In
Some market participants choose to build positions gradually—buying in smaller portions across several weeks—rather than committing a large amount at a single price. This can reduce the impact of being early if the market dips further before reversing.
– Setting Clear Invalidation Levels
In a speculative asset like PEPE, defining ahead of time where the trade thesis is invalidated can prevent emotional decision‑making. For many, a sustained break and close below the identified support zone would serve as a clear exit signal.
Long-Term Perspective vs. Short-Term Speculation
PEPE’s story is closely tied to the broader phenomenon of meme coins, where community narratives, viral attention, and speculative fervor can drive extreme price swings in both directions. For long‑term participants, the question is whether PEPE can evolve beyond short bursts of hype and maintain relevance in an increasingly competitive altcoin landscape.
A move to $0.000022 by 2026, as suggested by the analyst, would place PEPE just below its historical peaks and would likely require:
– A healthier overall crypto market, with renewed retail inflows.
– Continued visibility of meme coins as a distinct speculative niche.
– Sufficient liquidity on major spot and derivatives venues to support larger moves.
Short‑term traders, on the other hand, may focus less on multi‑year narratives and more on the upcoming weeks and months: whether the current trendline retest holds, how quickly PEPE can reclaim lost resistance zones, and whether volatility remains tradable.
What to Watch Next
In the coming period, a few key signals could help determine whether the bullish 430% scenario is gaining traction or fading:
1. Price Behavior at $0.000004–$0.0000045
Holding above this band and converting it into a clear support zone is critical. Multiple successful tests of this level would strengthen the argument for a durable bottom.
2. Breakouts Above Resistance Levels
Monitoring PEPE’s interaction with $0.00000958 and $0.00001340 will be essential. Clean breaks, followed by consolidation rather than immediate rejection, would suggest that new, stronger buyers are stepping in.
3. Relative Strength vs. Other Altcoins
If PEPE starts outperforming other meme coins and the broader altcoin market during rebounds, it could signal that capital is rotating back into the token and that sentiment is improving.
4. Broader Market Tone
Recovery in large‑cap assets, especially Bitcoin and leading altcoins, would reduce systemic pressure on high‑beta tokens like PEPE. Conversely, further macro‑driven sell‑offs could keep PEPE under sustained pressure.
Bottom Line
PEPE has endured a harsh correction since October 2025, losing over half its value and revisiting price zones from more than a year ago. Yet, from a technical standpoint, this deep pullback may be paving the way for a potential reversal.
Analyst MMBTtrader’s view is that the coin is close to completing a year‑long bearish phase and is now testing a critical trendline that originated in May 2025. If this retest holds and the $0.000004–$0.0000045 region is defended, PEPE could be positioned for a substantial rally—potentially up to 430%, toward $0.000022 by 2026.
However, the bullish roadmap demands that PEPE clear several resistance zones and that market conditions do not deteriorate further. For anyone watching or trading PEPE, the battle around the current support area, and the subsequent reaction at higher resistance levels, will likely define whether this memecoin’s next chapter is a powerful rebound or an extended consolidation at lower prices.